Fixture Overload Metrics: How Calendar Density Alters Projection Reliability for Multi-League Football Tipster Packages
Sam Washington · Jul 28, 2026
Fixture Overload Metrics: How Calendar Density Alters Projection Reliability for Multi-League Football Tipster Packages
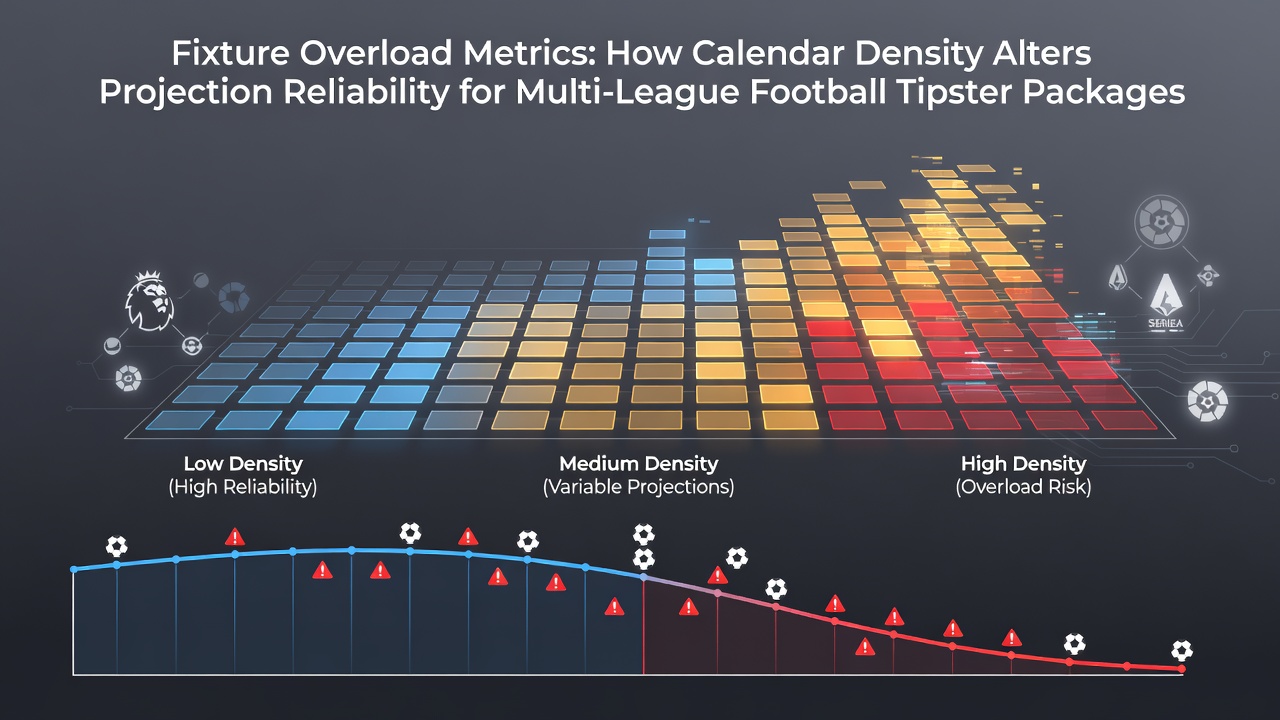
Football tipster packages that span several leagues face unique pressures when club calendars pack matches into short windows, and analysts track fixture overload metrics to measure how these clusters shift the accuracy of performance forecasts. Researchers at sports analytics firms compile data on consecutive games, travel distances, and recovery intervals, then compare those variables against historical outcomes to identify where standard models lose precision.
Calendar Density Patterns Across Major Leagues
European domestic schedules create overlapping demands during winter and spring months, while summer tournaments add further strain for clubs with international players. Data from the 2025-26 season shows teams in the English Premier League, Bundesliga, and Serie A often play three matches within eight days, a pattern that repeats across multiple competitions simultaneously. Observers note that such density spikes coincide with measurable drops in goal-scoring consistency and defensive organization, factors that projection systems must adjust for when generating multi-league selections.
Figures released by the European Club Association indicate that average player workload rose 12 percent between 2022 and 2025, driven largely by expanded domestic cups and continental fixtures. These increases force tipster services to recalibrate expected goal totals and clean-sheet probabilities, especially for squads competing in four competitions at once.
Impact on Multi-League Projection Models
Projection reliability declines when models trained on standard weekly schedules encounter fixture clusters, because fatigue effects compound differently than isolated high-intensity games. Analysts adjust inputs for metrics such as total distance covered in the prior 14 days, number of matches exceeding 90 minutes, and short-haul travel frequency. Studies conducted by university sports science departments in Canada and Australia demonstrate that these adjustments reduce forecast error rates by up to 8 percent compared with unadjusted baselines.
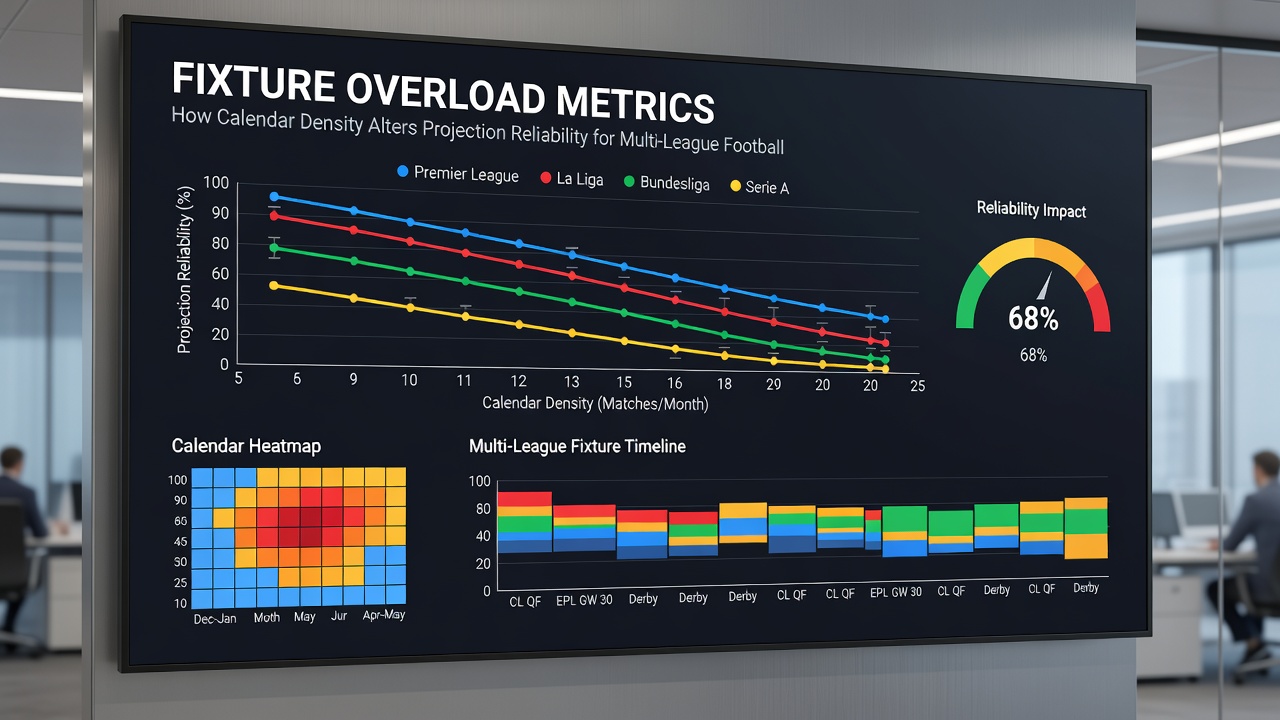
Tipster packages covering the Premier League alongside La Liga and the Eredivisie encounter additional complexity because each league’s fixture congestion follows distinct rhythms. One research paper published in the Journal of Sports Sciences tracked 1,200 matches across three seasons and found that teams playing twice in 72 hours showed a 15 percent reduction in high-intensity running output, a variable directly linked to both goal creation and concession rates. Services that incorporate these workload indicators produce more stable outputs across their multi-league offerings.
July 2026 Scheduling Pressures
The FIFA World Cup 2026, scheduled across North America from June through July, creates an unusual mid-year fixture squeeze for clubs resuming domestic campaigns shortly after international duties conclude. Pre-season friendlies and early league rounds overlap with recovery periods for players who featured in multiple tournament matches, prompting analysts to monitor training-load data released by clubs in July 2026. Early indicators from similar post-tournament periods suggest elevated variance in opening-week performance metrics, which in turn affects the reliability of accumulator and double selections built around those fixtures.
Adjusting Metrics for Improved Accuracy
Teams that employ rolling workload indices rather than static form ratings maintain higher projection stability during dense periods. These indices combine GPS-tracked distance, heart-rate recovery scores, and match-minute accumulation into a single fatigue score updated after every fixture. Industry reports from the German Football League show that clubs sharing such data with analytics partners achieve closer alignment between projected and actual results in congested months.
Multi-league tipster services integrate these scores into ensemble models that weight recent fixtures according to recovery time rather than chronological order. The approach accounts for the fact that a midweek cup tie followed by a weekend league match produces different fatigue signatures than two league games spaced evenly across the same window.
Conclusion
Fixture overload metrics supply a measurable framework for understanding how calendar density influences the reliability of performance projections in multi-league football tipster packages. By tracking workload indicators, travel patterns, and recovery intervals, analysts refine models to reflect real-world conditions rather than idealized schedules. As international tournaments such as the 2026 World Cup continue to intersect with domestic calendars, ongoing refinement of these metrics supports more consistent outputs across diverse league coverage.